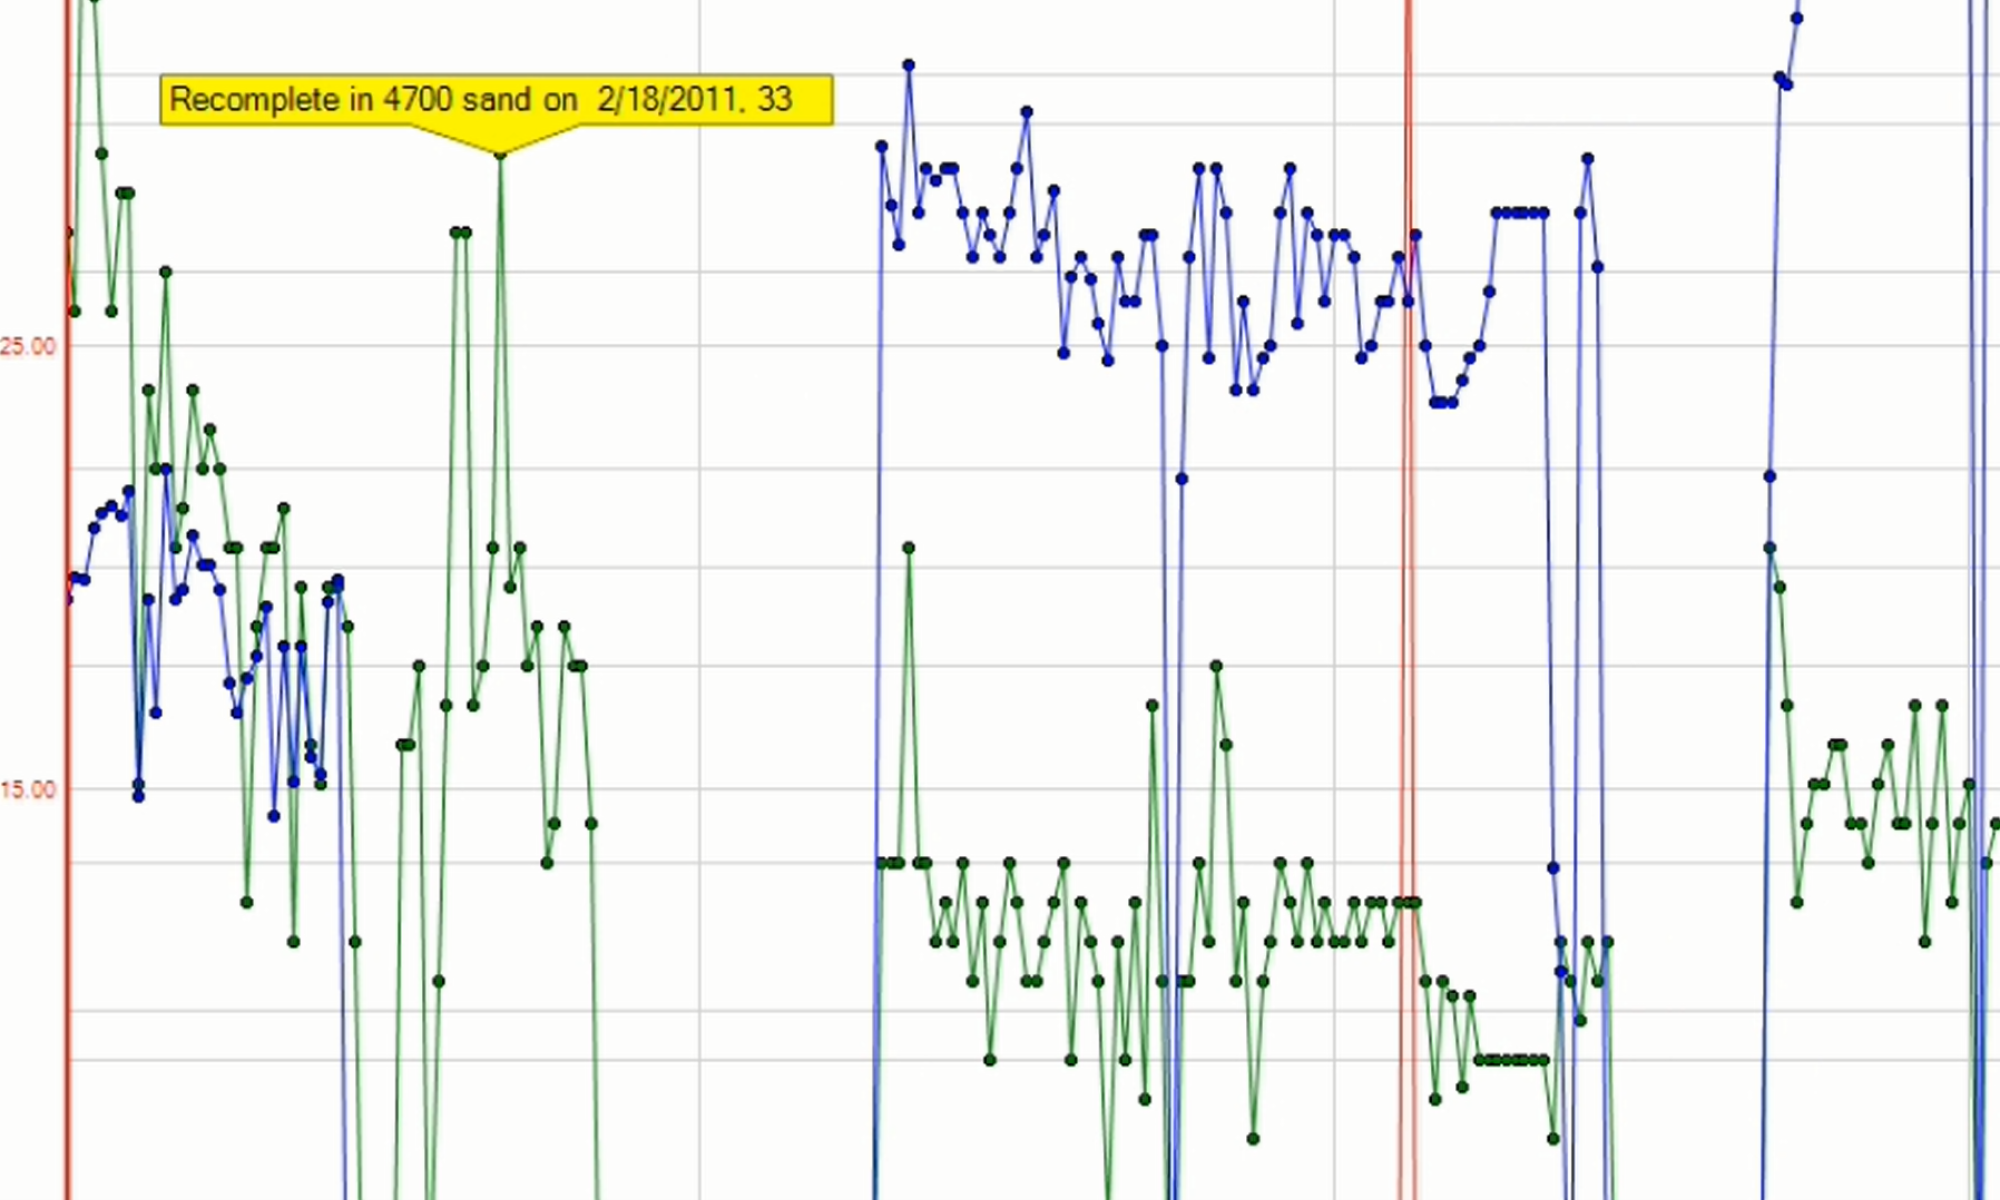
Hey DIYers: you asked and we listened, Productioneer now has a new tab for you to create your own charts. We know you love our built-in charts but you still would like to be able to create your own, we get it!
On a more serious note: any data series usually available in a canned Productioneer report or chart or dashboard will be available for plotting on your DIY Charts. The new charts templates you create can be saved, annotated, shared, cloned, printed, pickled, etc.
We know you don’t read the manual so we didn’t make one for this feature.
The video below is a quick demo, try it out or let us know if you would like more hands on training.
As usual, we appreciate your feedback so we can make it better!
Warning: Any eye damage caused by improper use of neon green or fuchsia in your DIY charts is not our fault!!!
At Mi4, we constantly work to improve our software and our solutions services. The latest version of Productioneer includes several expanded or improved features, plus a few entirely new features. DIY Charts For the first time, Productioneer (2.5.0.0) offers users the ability to make “DIY Charts.” The chart module (BETA)…
Mi4 is excited to announce the public release of the Productioneer Report Portal to all of our Productioneer customers. The Productioneer Report Portal allows Productioneer users to see their Productioneer reports directly in a web browser. To use the portal, users do not need to have Productioneer installed on their…
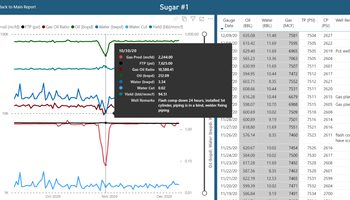
We are happy to announce that in December 2020 Mi4 released an update to the Production Review Dashboard with new features and functionality. This dashboard is available to all Productioneer customers and allows oil and gas organizations to efficiently aggregate and analyze oil and gas production across a diverse collection of assets quickly and efficiently in one report. The Production Review Dashboard offers oil…